Killing Them Softly
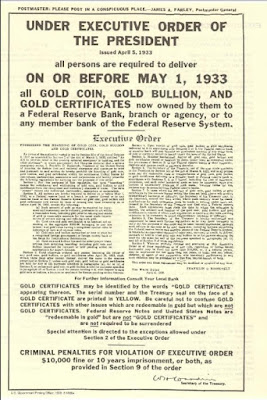
Executive Order 6102 signed by
FDR made U.S. Citizen ownership of gold illegal in 1933. This act of tyranny went unchallenged for almost as long as his cousin Teddy Roosevelt's statue stood in front of the American Museum of Natural History. The two men could not have been more diametrically opposite in their policies, yet they were both men of their times. Sadly, it seems like we're reliving the early 20th Century all over again, both politically and socially with a pandemic which follows the
Spanish Flu almost cough for cough, an exit (entry?) into global conflict, and socialism rearing its Medusa head.
Change the dates and change the names and the resemblance is uncanny. Word War I raged in the midst of the Spanish Flu, and the "war to end all wars" finally ended on November 11th, 1918. The Spanish Flu swept around the world from February 1918 until April 1920 (give or take some months, of both sides of that figure.) The mortality rate of the two accounted for some 70 million deaths, of a population of 1.9 billion. Equivalent deaths today would be on the order of 300,000,000. That is a staggering figure. But what happened next in the early 1920s and what is happening today should scare the bejesus out of you.
When there is a vacuum in power, wealth, influence, leadership, ability, morality, etc., etc. it is usually quickly filled; indeed the adage "nature abhors a vacuum" is poignant and precise. Who or what fills that vacuum now is troubling for both financial farmers and more so to the citizens of this country. Just like Executive Order 6102, which made owning God's money, gold, illegal we are seeing a game plan right out of 1933.
If a government wants to fundamentally change the fabric of a society, it kills them softly. A two-pronged approach of utilizing acts of omission and commission works best. The players are on the field and the game has begun, with the first salvo being the most destructive, which of course is an act of omission. Getting something done in Washington is actually pretty hard, even if you are the ruling party. You often don't have the majority and then there is the pesky voting to worry about...but acts of omission? Oh boy, such opportunity!
National sovereignty is probably the most binary political issue there is...either a country has sovereignty or it doesn't, and all natural law flows from that fact. If a country does not have sovereignty, then it is not a nation by definition. It is a group of people who live in a certain geography. There is no border, there is no law inside that border, and there is no enforcement of said law(s). There is no shared value system, there is no language, there is no culture, there is simply of place residence.
So if you want to dilute or negate the rights of citizens presumably in a nation, you simply ignore the presumption of a nation with borders. That's an easy act of omission that has a massive impact and can be accomplished by doing nothing, yet advances your political goals immensely. But that's just one variable to the final solution of a central government.
The two other pieces to the "triumvirate" are Regulation and Taxation. Those two can pretty much steer a country to prosperity and freedom or doom and tyranny; although some voting might be involved by elected "representatives," a LOT of damage can be done with a regime fixated on changing the fabric of society via executive order.
Consider, FDR essentially made illegal a basic human right of the pursuit of happiness by outlawing gold as a store of value. This ring especially true today, where the first item on the IRS Form 1040 is a question about "crypto." Another way to regulate freedom is to require disclosure of something, and naturally then to tax it. And was we well know, the more you tax something the less of it you get. Let me say that again; the more you tax something, the less you get.
So less energy production, fewer side hustles, less crypto, less innovation, etc. etc. Ad nauseam. The end result of these polices inevitably less freedom for citizens and more control by the central government. Side effects naturally are the breakdown of society; more crime, more corruption, less enforcement, less good medical care, less good education, less good services in general.
When everything is free, nothing has value. Socialism's grip is tight. It provides government with tremendous control over its population. Just take a look at Australia and New Zealand, which have become de facto police states controlled by bureaucrats who have thoroughly embraced the strategy of "Killing Them Softly."